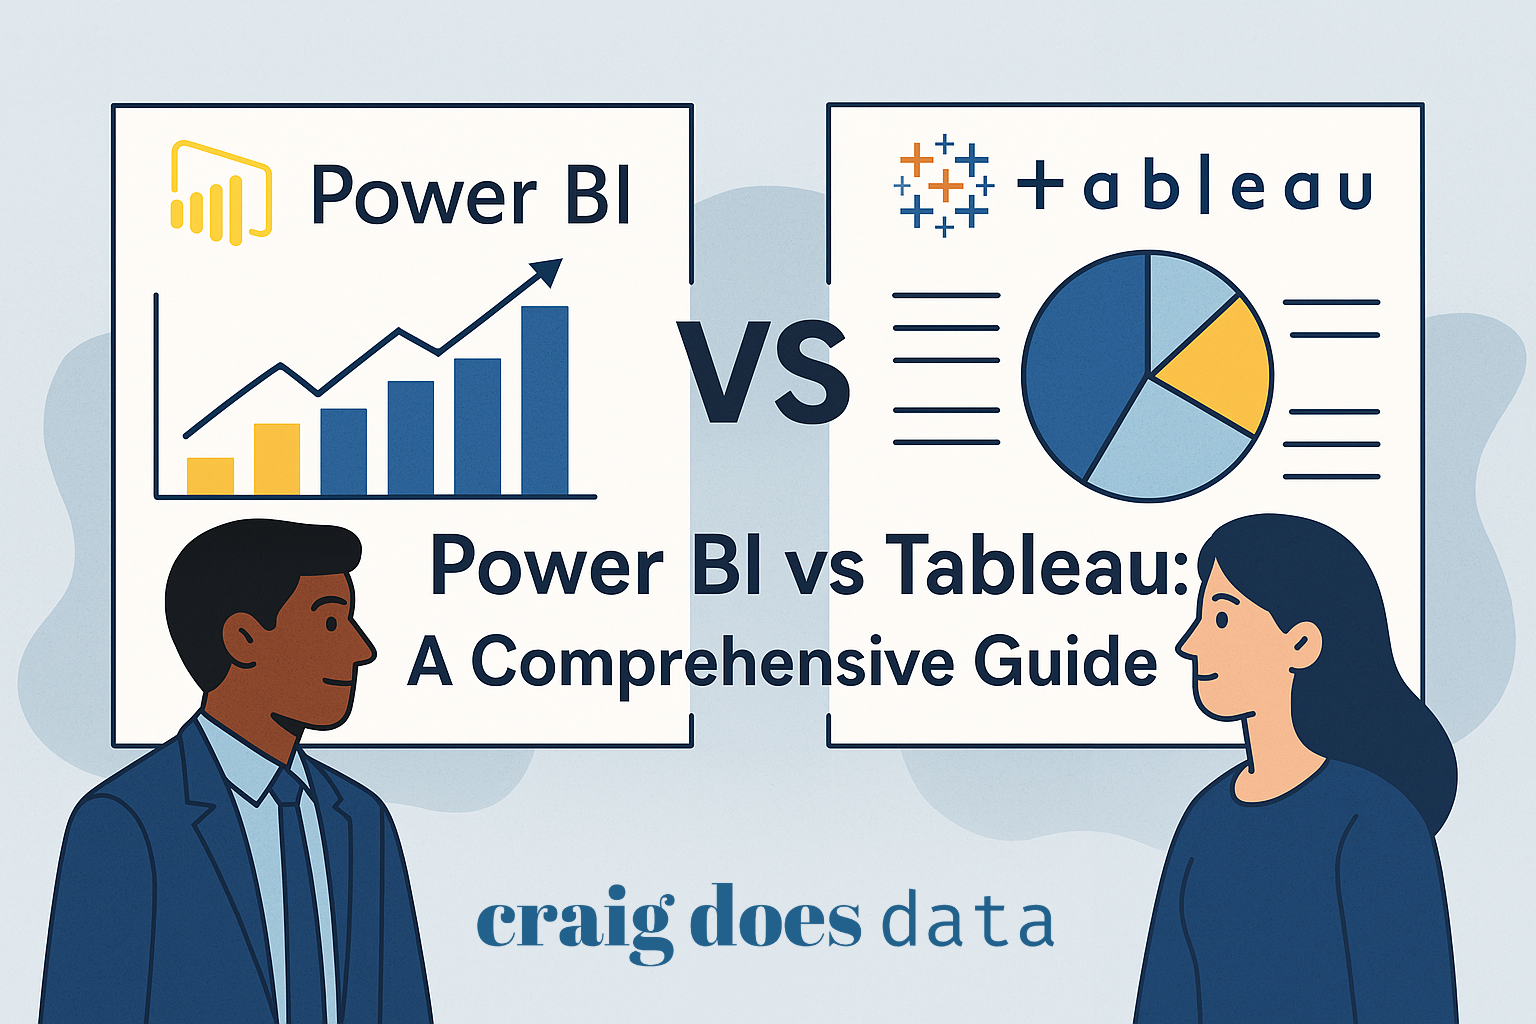
Power BI vs Tableau: A Comprehensive Guide for Business Professionals and Small Business Owners
In today's fast-paced business environment, data is no longer just a byproduct of operations—it's the compass guiding strategic decisions, the fuel for innovation, and the bedrock of competitive advantage. For businesses of all sizes, from burgeoning startups to established enterprises, the ability to effectively analyze and visualize data is paramount. Harnessing the power of data analytics allows organizations to uncover hidden trends, optimize processes, understand customer behaviors, and ultimately, drive growth and profitability.
Enter Business Intelligence (BI) and data visualization tools – the modern-day analytical powerhouses that transform raw data into actionable insights. Among the plethora of options available, two platforms consistently emerge as industry leaders: Power BI and Tableau. Both are robust, feature-rich, and widely adopted, empowering users to explore data, create compelling visualizations, and share insights across their organizations. But with such powerful capabilities, choosing between Power BI and Tableau can feel like navigating a complex maze. Which tool is the right fit for your business? Which aligns best with your technical capabilities, budget, and long-term analytical goals?
This comprehensive guide is designed to demystify the Power BI vs. Tableau dilemma. We aim to provide business professionals and small business owners with a clear, unbiased comparison of these two leading platforms. We will delve into their core functionalities, strengths, weaknesses, and unique features. Whether you are a data novice taking your first steps into data analytics or an experienced analyst looking to optimize your toolkit, this guide will equip you with the knowledge to make an informed decision. We will explore everything from ease of use and data connectivity to pricing, security, and community support, ensuring you understand not just what these tools *are*, but how they can *transform* your business. Let’s embark on this analytical journey together and discover which BI champion – Power BI or Tableau – will best empower your data-driven success.
1. Understanding Power BI and Tableau
Before diving into a detailed comparison, it's crucial to establish a foundational understanding of what Power BI and Tableau are, their origins, and their primary objectives. While both tools operate within the realm of data visualization and business intelligence, their backgrounds and core philosophies offer distinct perspectives that influence their functionalities and user experiences.
What is Power BI?
Power BI, short for Power Business Intelligence, is a data visualization and business analytics tool developed by Microsoft. Born from Microsoft's deep-rooted expertise in software and enterprise solutions, Power BI has rapidly ascended to become a dominant player in the BI landscape. Its origins can be traced back to add-ins for Microsoft Excel, such as Power Query, Power Pivot, and Power View, which were later consolidated and expanded into the standalone Power BI platform we know today. This lineage is significant because it imbues Power BI with a natural affinity for the Microsoft ecosystem, making it particularly appealing to organizations heavily invested in Microsoft technologies.
Key Features and Capabilities of Power BI:
- Data Connectivity: Power BI boasts extensive data connectivity options, seamlessly integrating with a vast array of data sources, including databases (SQL Server, Azure SQL Database, Oracle, MySQL, etc.), cloud services (Azure, AWS, Google Cloud), files (Excel, CSV, XML), and various online platforms (Salesforce, Google Analytics, Dynamics 365). Its strength lies particularly in its native integration with Microsoft Azure services and other Microsoft products, offering a streamlined experience for users within the Microsoft ecosystem.
- Data Transformation (Power Query): Power Query, a robust data transformation engine embedded within Power BI, empowers users to cleanse, shape, and transform data from diverse sources without requiring extensive coding knowledge. Its user-friendly interface allows for complex data manipulations through a visual, point-and-click approach, significantly simplifying data preparation tasks.
- Data Modeling (Power Pivot): Power Pivot enables users to build sophisticated data models, establish relationships between tables, and create calculated measures using DAX (Data Analysis Expressions), Power BI's formula language. This capability is crucial for performing in-depth analysis and deriving meaningful insights from complex datasets.
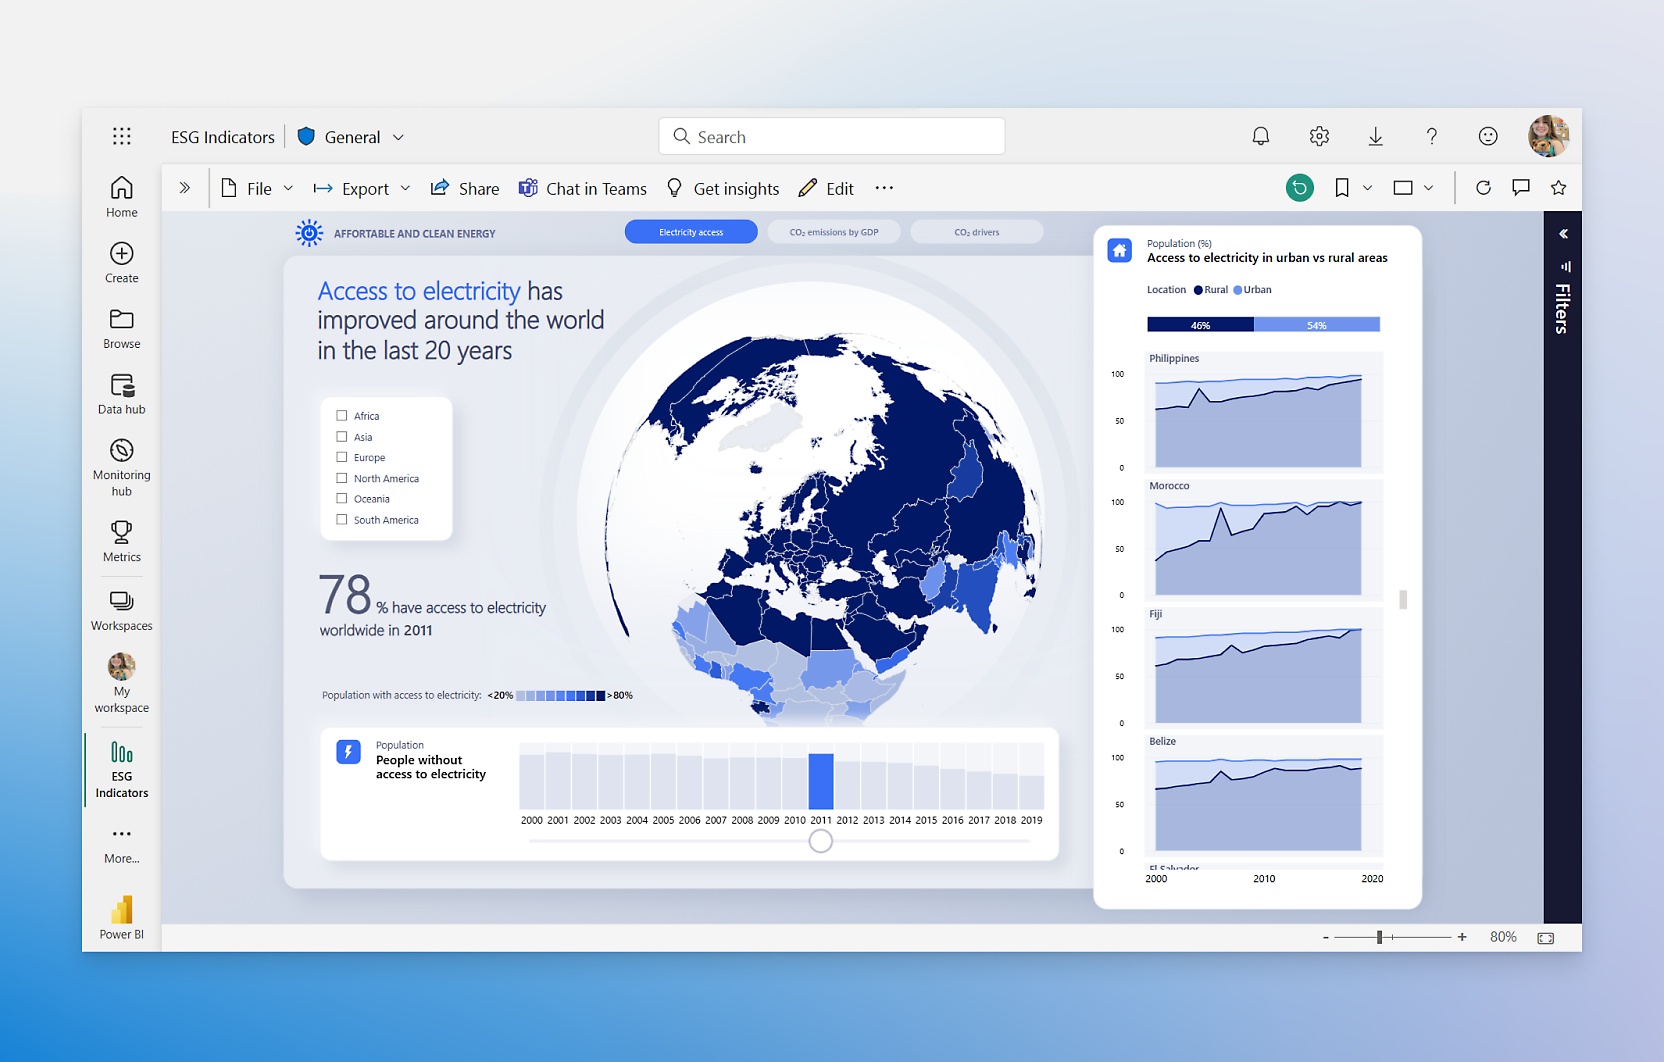
- Interactive Visualizations: Power BI offers a rich library of interactive visualizations, from standard charts (bar charts, line charts, pie charts) to more advanced options (treemaps, maps, gauges, KPIs). Users can easily create interactive dashboards and reports, allowing for dynamic data exploration and storytelling. Custom visualizations can also be imported or developed for specialized needs.
- Reporting and Dashboards: Power BI excels in creating interactive reports and dashboards that can be easily shared and embedded within applications or websites. Its reporting capabilities cater to both operational and strategic needs, providing real-time insights and historical analysis.
- Power BI Service and Cloud Integration: The Power BI Service, Microsoft's cloud-based platform, facilitates report publishing, sharing, collaboration, and scheduling data refresh. Its tight integration with Azure cloud services provides scalability, security, and accessibility from anywhere with an internet connection.
- Natural Language Query (Q&A): Power BI's Q&A feature allows users to ask questions about their data in natural language and receive instant visual answers. This intuitive capability democratizes data access, making it easier for non-technical users to gain insights without needing to build complex queries.
What is Tableau?
Tableau, in contrast, originated from a research project at Stanford University focused on improving data visualization and making data more accessible and understandable. Founded on the principle of "seeing and exploring data," Tableau has always prioritized visual analytics and user-centric design. Its core philosophy revolves around enabling users to intuitively interact with data, discover patterns, and communicate insights through compelling visualizations. Tableau's history is rooted in academic research and a deep commitment to visual best practices, which has shaped its user interface and analytical capabilities.
Key Features and Capabilities of Tableau:
- Data Connectivity: Tableau provides robust connectivity to a wide range of data sources, including databases (SQL Server, Oracle, MySQL, PostgreSQL, etc.), cloud data warehouses (Snowflake, Amazon Redshift, Google BigQuery), spreadsheets, and cloud applications. While it may not have the same level of native integration with the Microsoft ecosystem as Power BI, Tableau offers broad compatibility and strong performance across diverse data environments.
- Drag-and-Drop Interface: Tableau is renowned for its intuitive drag-and-drop interface, which empowers users to create visualizations rapidly and explore data interactively. This visual approach significantly lowers the barrier to entry for users without extensive technical skills, allowing them to quickly build complex charts and dashboards.
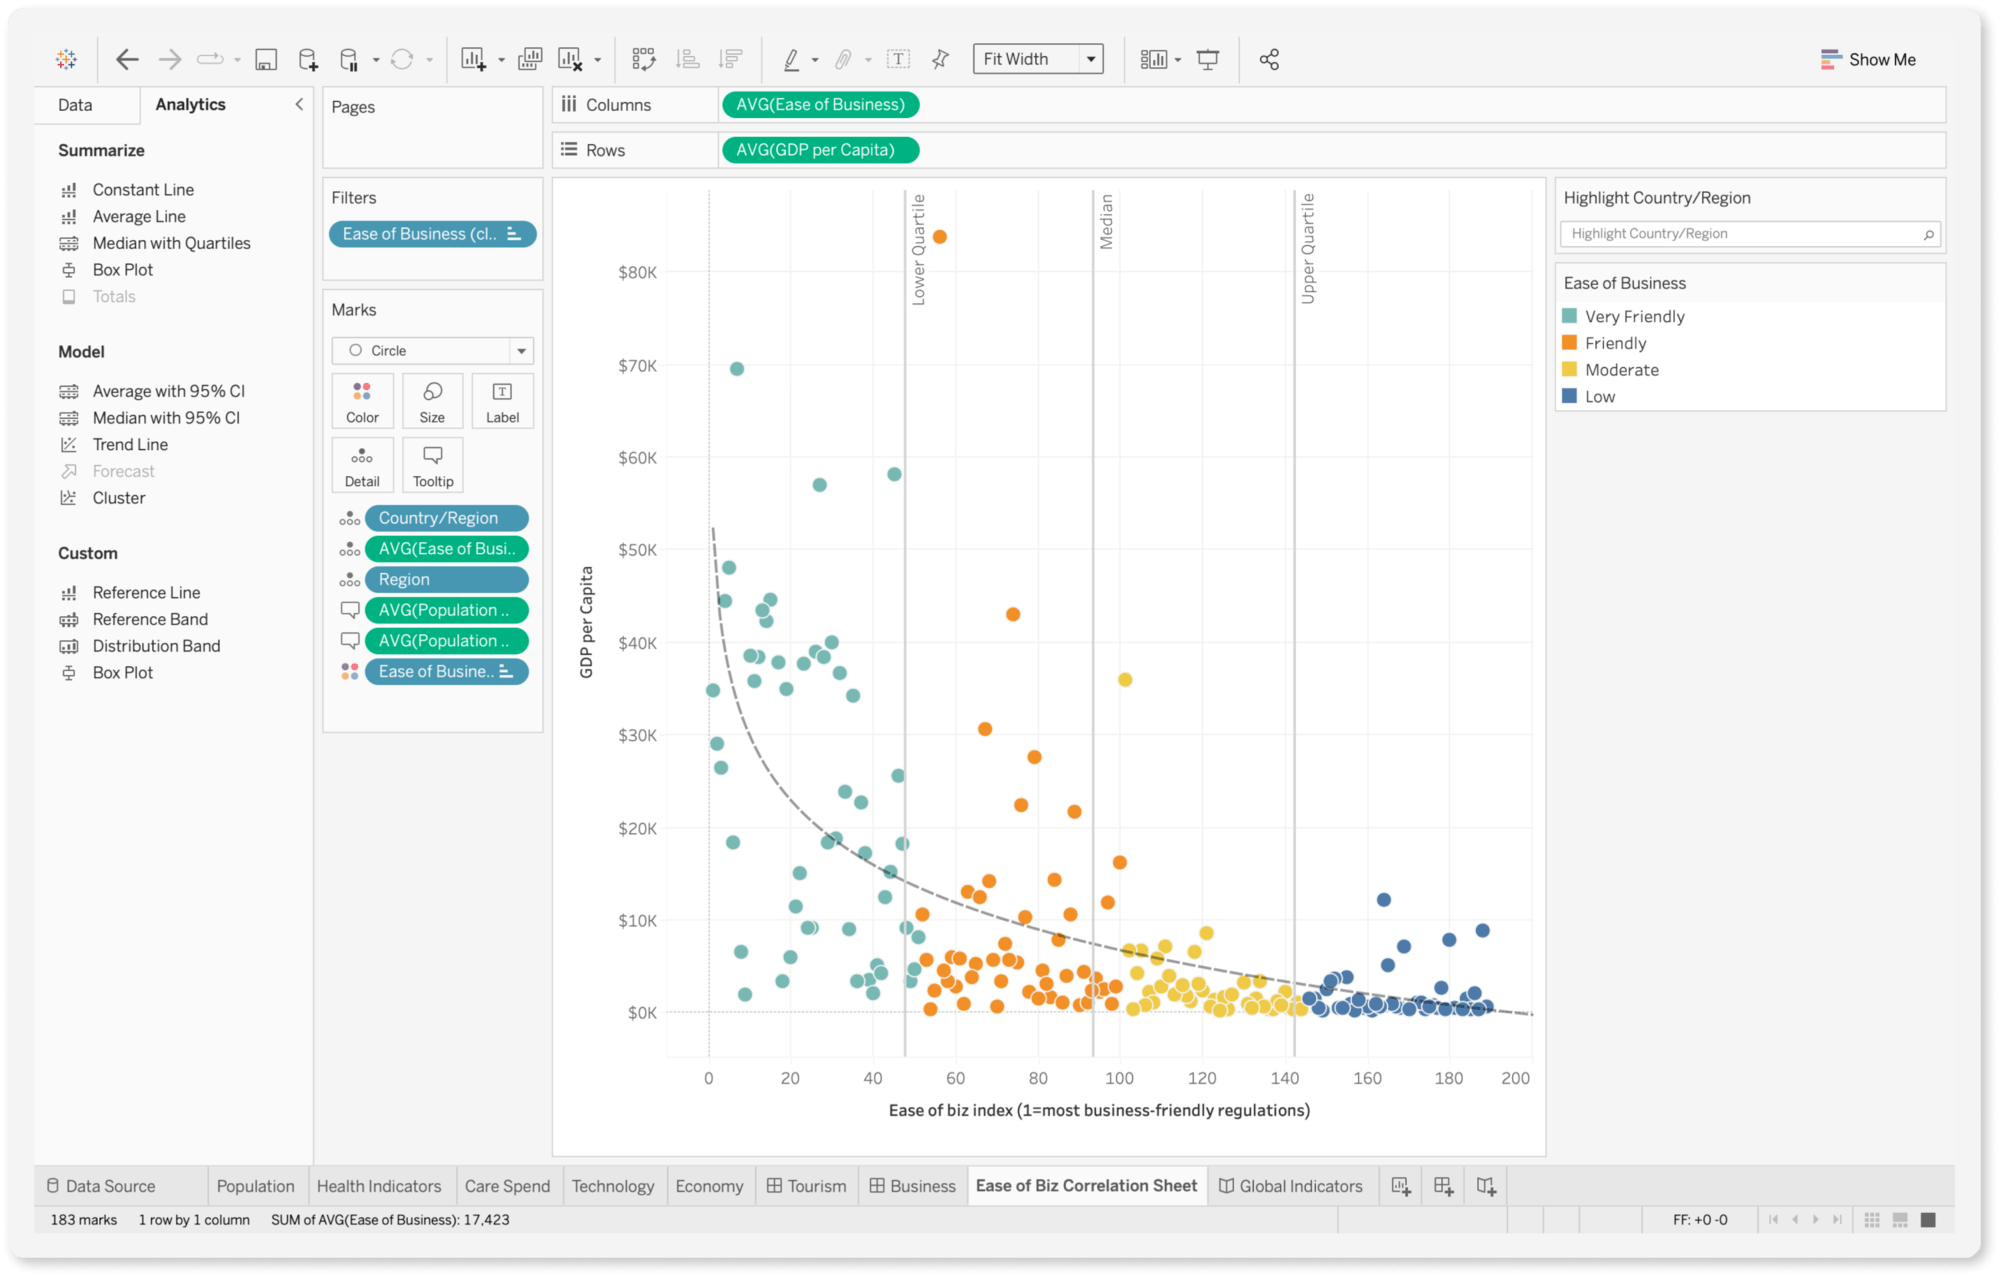
- Advanced Visual Analytics: Tableau excels in advanced visual analytics capabilities, offering a vast array of chart types and customization options. Its focus on visual best practices and storytelling features enables users to create highly impactful and insightful visualizations. Tableau's strength lies in its ability to handle complex visualizations and present data in a visually compelling manner.
- Data Blending: Tableau's data blending feature allows users to combine data from multiple disparate sources without requiring complex data modeling upfront. This is particularly useful for ad-hoc analysis and exploring relationships across different datasets without needing to build a unified data warehouse.
- Tableau Desktop, Server, and Online: Tableau offers a suite of products to cater to different needs. Tableau Desktop is the primary tool for visualization development, while Tableau Server is an on-premises platform for sharing and collaboration. Tableau Cloud is Tableau's cloud-hosted platform, providing similar functionality to Tableau Server in a fully managed cloud environment.
- Tableau Public: Tableau Public is a free version of Tableau Desktop that allows users to create and share visualizations publicly. It's a valuable resource for learning Tableau and showcasing data skills, although it has limitations in terms of data privacy and sharing options.
- Strong Focus on Data Storytelling: Tableau places a strong emphasis on data storytelling, providing features like story points and guided analytics to help users create narratives with their data. This focus on communication and presentation makes Tableau particularly effective for conveying insights to a broader audience.
2. Comparing Power BI and Tableau: Key Factors

With a foundational understanding of Power BI and Tableau established, we can now delve into a direct comparison of these two BI giants across several key factors. These factors are crucial for business professionals and small business owners to consider when evaluating which tool best aligns with their specific needs, technical capabilities, and organizational goals. We will examine ease of use, data connectivity, visualization capabilities, performance, and pricing to provide a balanced perspective.
Ease of Use
User Interface Comparison: Power BI and Tableau both strive for user-friendliness, but their approaches differ slightly. Power BI, with its Microsoft heritage, adopts a user interface that feels familiar to users of other Microsoft products, particularly Excel. Its ribbon-based interface and layout are generally considered intuitive for those accustomed to Microsoft Office applications. Tableau, on the other hand, emphasizes a more visually driven, drag-and-drop interface. Its workspace is designed to facilitate rapid visualization creation and data exploration through direct manipulation of data fields and visual elements.
Learning Curve and User-Friendliness for Beginners: For users completely new to data visualization tools, Power BI might present a slightly gentler initial learning curve, especially if they are already proficient in Excel. The familiarity of the Microsoft environment can make the initial navigation and basic functionalities easier to grasp. However, as users delve deeper into more advanced features like DAX for calculations and complex data modeling, the learning curve can steepen. Tableau, with its drag-and-drop interface, often feels immediately accessible for creating basic visualizations. Users can quickly start building charts and exploring data without needing extensive training. However, mastering Tableau's more advanced features, such as calculated fields, table calculations, and complex chart customizations, also requires dedicated learning and practice. Generally, both tools are designed to be accessible to business users, but the perceived ease of use can be subjective and depend on individual backgrounds and learning styles. Anecdotally, users with strong Excel backgrounds often find Power BI initially more comfortable, while those with a more visual or design-oriented mindset might gravitate towards Tableau's interface.
Data Connectivity
Supported Data Sources for Both Tools: Both Power BI and Tableau excel in their ability to connect to a vast and diverse range of data sources. They both support connectivity to common databases like SQL Server, Oracle, MySQL, PostgreSQL, cloud data warehouses such as Snowflake, Amazon Redshift, Google BigQuery, and various file types like Excel, CSV, and JSON. Furthermore, both platforms offer connectors to numerous cloud services and applications, including Salesforce, Google Analytics, and social media platforms. In terms of breadth of connectivity, both tools are highly competitive and cater to the data integration needs of most organizations.
Real-Time Data Streaming Capabilities: When it comes to real-time data streaming, both Power BI and Tableau offer capabilities, but their approaches and strengths differ. Power BI, particularly within the Microsoft Azure ecosystem, has strong native support for real-time data streaming through Azure Stream Analytics and Azure Event Hubs. It can seamlessly ingest and visualize data streams in near real-time, making it well-suited for scenarios requiring up-to-the-second insights, such as monitoring IoT devices, analyzing live social media feeds, or tracking real-time operational metrics. Tableau also supports real-time data connections, primarily through its Web Data Connector and direct connections to certain databases optimized for real-time analytics. While Tableau can handle real-time data, it's often perceived as slightly less natively integrated with dedicated real-time streaming platforms compared to Power BI's Azure-centric approach. For organizations heavily invested in the Microsoft Azure cloud and requiring robust real-time analytics capabilities, Power BI might have a slight edge. However, Tableau can effectively handle real-time data visualizations, especially when connected to databases or systems designed for streaming data.
Visualization and Reporting
Variety and Customization of Charts and Reports: Both Power BI and Tableau offer an extensive library of chart types, ranging from basic bar charts and line graphs to more sophisticated visualizations like treemaps, scatter plots, geographical maps, and network diagrams. In terms of variety, both platforms are highly competitive, providing users with a wide palette of options to represent their data visually. Customization is where some subtle differences emerge. Tableau is often lauded for its granular control over visualization aesthetics and formatting. Users can fine-tune almost every aspect of a chart's appearance, from colors and fonts to annotations and tooltips. This level of customization makes Tableau particularly favored by users who prioritize highly polished, visually stunning dashboards and reports. Power BI, while also offering substantial customization options, is sometimes perceived as slightly less flexible in achieving pixel-perfect visual designs compared to Tableau. However, Power BI is continuously evolving, and its customization capabilities are rapidly expanding. Power BI's strength in reporting lies in its seamless integration with the Power BI Service, facilitating easy report sharing, embedding, and collaboration. Tableau also offers robust reporting and sharing capabilities through Tableau Server and Tableau Cloud.
Interactive Dashboards and Storytelling Features: Both Power BI and Tableau excel in creating interactive dashboards that allow users to drill down into data, filter visualizations, and explore insights dynamically. The interactivity features in both tools are robust and enable users to engage with data in a meaningful way. Tableau, however, is often recognized for its stronger emphasis on data storytelling. Tableau's Stories feature allows users to create guided narratives with their visualizations, leading viewers through a structured exploration of data insights. This storytelling focus is a key differentiator for Tableau, making it particularly effective for presentations and communicating data-driven narratives to a wider audience. Power BI also offers interactive dashboards and report pages, and while it may not have a dedicated "story points" feature in the same way as Tableau, users can achieve data storytelling through thoughtful dashboard design, report sequencing, and the use of features like bookmarks and selections to guide viewers through insights.
Performance and Speed
Handling of Large Datasets and Processing Speed: Both Power BI and Tableau are designed to handle large datasets and deliver performant visualizations. However, their underlying architectures and approaches to data processing differ, which can impact performance in certain scenarios. Power BI, particularly when leveraging its Power BI Premium capacity and optimized data modeling techniques, can efficiently handle very large datasets. Its in-memory engine (VertiPaq) and columnar storage are designed for fast query performance and data compression. Tableau, with its data engine (Hyper), also boasts impressive performance when handling large datasets. Hyper is designed for fast in-memory analytics and can efficiently query and visualize large volumes of data. In general, both tools are capable of delivering good performance with large datasets, but performance can be heavily influenced by factors such as data source optimization, data model design, complexity of visualizations, and underlying infrastructure.
Comparison of Performance Optimization Features: Power BI offers features like aggregations, query reduction techniques, and the ability to optimize DAX queries to enhance performance. Power BI Premium capacity provides dedicated resources and features like DirectQuery for large datasets that can further improve performance. Tableau provides performance optimization features like data extracts, query caching, and the ability to optimize workbooks for speed. Tableau Server also offers performance monitoring and tuning capabilities. Both platforms provide users with tools and best practices to optimize performance, but achieving optimal speed often requires a combination of tool-specific techniques and general data warehousing and database optimization principles. In highly demanding performance scenarios with extremely large datasets or complex analytical workloads, careful performance testing and optimization are crucial for both Power BI and Tableau.
Pricing and Cost-Effectiveness
Overview of Pricing Models and Licensing Options: Pricing is a significant factor for businesses, especially small businesses and startups. Power BI and Tableau have distinct pricing models. Power BI primarily operates on a subscription-based model, with different tiers catering to individual users, teams, and enterprises. Power BI Pro is the standard per-user license, while Power BI Premium offers advanced features, dedicated capacity, and enterprise-scale capabilities. Tableau also employs a subscription model, with different licenses for Tableau Creator, Explorer, and Viewer, each offering varying levels of functionality and access. Tableau Public is a free version with limited features and public data sharing.
Cost Implications for Small Businesses and Enterprises: For small businesses and individual users, Power BI often presents a more cost-effective entry point, particularly if they are already invested in the Microsoft ecosystem. Power BI Pro is generally priced competitively, and for organizations already using Microsoft 365, Power BI can be bundled or integrated, potentially reducing overall costs. Tableau, while offering powerful features, is generally perceived as having a higher price point, especially for full Creator licenses. For enterprises with large-scale deployments and advanced requirements, both Power BI Premium and Tableau Enterprise offer enterprise-grade features and scalability, but the overall cost can vary depending on the specific licensing model and deployment needs. Cost-effectiveness is not solely about the license price; it also involves considering factors like training costs, implementation effort, and the long-term value derived from the tool. Small businesses should carefully evaluate their budget, feature requirements, and expected usage patterns to determine the most cost-effective option between Power BI and Tableau. For organizations heavily reliant on Microsoft technologies, Power BI's integration and potential bundling advantages can make it a very attractive and cost-effective choice.
3. Integration and Compatibility

The ability of a BI tool to seamlessly integrate with existing systems and platforms is paramount for maximizing its value and minimizing disruption. Integration and compatibility encompass several dimensions, including integration with other software tools, mobile access, and responsiveness across different devices. This section will explore how Power BI and Tableau fare in these critical areas.
Integration with Other Tools
How Power BI Integrates with Microsoft Ecosystem (Excel, Azure, etc.): Power BI's deep integration with the Microsoft ecosystem is one of its strongest selling points. It seamlessly integrates with Microsoft Excel, allowing users to import Excel workbooks, Power Query queries, and Power Pivot data models directly into Power BI. This tight integration is a significant advantage for organizations heavily reliant on Excel for data management and analysis. Power BI also integrates natively with Microsoft Azure cloud services, including Azure SQL Database, Azure Data Lake Storage, Azure Synapse Analytics, and Azure Machine Learning. This Azure integration provides a streamlined path for building end-to-end data analytics solutions in the Microsoft cloud. Furthermore, Power BI integrates with other Microsoft business applications like Dynamics 365, SharePoint, and Teams, enabling embedding of reports and dashboards within these platforms for broader accessibility and collaboration. This comprehensive integration within the Microsoft ecosystem simplifies data workflows, reduces integration complexities, and enhances overall productivity for organizations standardized on Microsoft technologies.
Tableau’s Compatibility with Other Platforms and Services: While Tableau may not have the same level of native integration with the Microsoft ecosystem, it offers broad compatibility with a wide range of platforms and services. Tableau integrates well with various databases, cloud data warehouses, and cloud platforms, including AWS, Google Cloud, and Snowflake. It also provides APIs and connectors to integrate with other business applications and services. Tableau's strength lies in its open architecture and its ability to work effectively in diverse technology environments. While it might require slightly more configuration or custom connectors in certain Microsoft-centric environments compared to Power BI, Tableau's compatibility is extensive and caters to organizations with heterogeneous IT landscapes. For organizations that are not exclusively tied to the Microsoft ecosystem and require flexibility in integrating with various platforms and services, Tableau's broad compatibility makes it a strong contender.
Mobile Access and Responsiveness
Mobile App Features and Mobile-Friendly Dashboards: In today's mobile-first world, access to data and insights on mobile devices is crucial. Both Power BI and Tableau offer dedicated mobile apps for iOS and Android, enabling users to view and interact with dashboards and reports on the go. Power BI Mobile app provides features like interactive reports, data alerts, annotations, and the ability to share reports directly from mobile devices. Tableau Mobile app offers similar functionalities, including interactive visualizations, offline access to dashboards, and mobile-optimized layouts. Both apps are designed to provide a user-friendly mobile BI experience, allowing business professionals to stay informed and make data-driven decisions from anywhere.
Comparison of Responsiveness and Accessibility on Different Devices: Both Power BI and Tableau dashboards and reports are designed to be responsive and accessible across different devices, including desktops, tablets, and smartphones. However, the level of responsiveness and optimization can vary depending on the complexity of the dashboards and the design choices made during development. Tableau is often praised for its automatic device layouts feature, which intelligently optimizes dashboards for different screen sizes, ensuring a consistent and user-friendly experience across devices without requiring manual adjustments for each device type. Power BI also offers mobile layout views, allowing developers to customize report layouts specifically for mobile devices. While both tools strive for responsiveness, Tableau's automatic device layouts might offer a slight edge in simplifying the process of creating mobile-optimized dashboards, especially for users who prioritize ease of mobile design and cross-device consistency. In general, both platforms provide good mobile accessibility, but careful dashboard design and leveraging device-specific layout features are essential for ensuring optimal viewing and interaction on smaller screens.
4. Security and Governance

Data security and governance are paramount concerns for organizations adopting BI tools, especially when dealing with sensitive business data. This section will compare the security measures and governance features offered by Power BI and Tableau, focusing on data security, compliance standards, user access control, and permissions management.
Data Security Measures
Security Features and Compliance Standards for Power BI: Power BI, being a Microsoft product, benefits from Microsoft's robust security infrastructure and adherence to industry-leading compliance standards. Power BI leverages Azure Active Directory (Azure AD) for user authentication and authorization, providing enterprise-grade identity management and access control. Data encryption is employed both at rest and in transit, protecting data from unauthorized access. Power BI complies with numerous security and compliance certifications, including ISO 27001, SOC 2, HIPAA, and GDPR, demonstrating its commitment to data protection and regulatory compliance. Row-level security (RLS) in Power BI allows administrators to restrict data access based on user roles or attributes, ensuring that users only see the data they are authorized to view. Data loss prevention (DLP) policies can be configured to prevent sensitive data from being inadvertently shared or leaked. Power BI's security features are comprehensive and designed to meet the stringent security requirements of enterprise organizations.
Tableau’s Approach to Data Security and Governance: Tableau also places a strong emphasis on data security and governance. Tableau Server and Tableau Online offer robust authentication and authorization mechanisms, integrating with various identity providers and supporting multi-factor authentication. Data encryption is available both at rest and in transit, protecting data confidentiality. Tableau also complies with relevant security and compliance standards, including SOC 2 and GDPR. Row-level security (RLS) in Tableau allows for granular data access control based on user roles and permissions. Tableau Data Server provides a centralized platform for managing and securing data connections, ensuring consistent data access policies across the organization. Tableau's security approach is comprehensive and provides organizations with the tools to protect sensitive data and maintain data governance standards. Both Power BI and Tableau offer strong security capabilities, but Power BI's deep integration with Microsoft Entra ID (formerly Azure AD) and Microsoft's broader security ecosystem might be perceived as a slight advantage for organizations already heavily invested in Microsoft security technologies.
User Access and Control
Role-Based Access Control and Permissions Management: Both Power BI and Tableau implement role-based access control (RBAC) to manage user permissions and control access to data, reports, and dashboards. In Power BI, administrators can assign roles to users or groups, defining their permissions at the workspace, app, or dataset level. Roles can be customized to grant different levels of access, such as view-only, edit, or admin privileges. Tableau also offers robust RBAC capabilities, allowing administrators to define user roles and permissions at the project, workbook, or data source level. Permissions can be granularly configured to control actions like viewing, editing, publishing, or connecting to data. Both platforms provide flexible and comprehensive RBAC systems, enabling organizations to enforce the principle of least privilege and ensure that users only have access to the resources they need. The RBAC features in both Power BI and Tableau are mature and well-suited for managing user access control in complex organizational environments. Choosing between them in terms of RBAC functionality often comes down to organizational preferences and existing identity management infrastructure.
5. Community and Support

A strong community and reliable support resources are invaluable when adopting and using any software tool, especially complex BI platforms. This section will evaluate the user communities and official support options available for Power BI and Tableau, helping businesses understand the level of assistance and resources they can expect.
User Community
Size and Activity of Power BI and Tableau User Communities: Both Power BI and Tableau boast large, active, and vibrant user communities. These communities are invaluable resources for users seeking help, sharing knowledge, and staying up-to-date with the latest features and best practices. Power BI community, being backed by Microsoft, benefits from a massive global user base and a highly active online forum. The Power BI community forum is a bustling hub for questions, answers, and discussions, with Microsoft employees and community experts actively participating. Tableau community is also very strong and passionate, known for its collaborative spirit and visually rich content. Tableau Community Forums are well-organized and offer a wealth of resources, including user-generated visualizations, tutorials, and best practice guides. Both communities are extensive and provide ample support for users of all skill levels. In terms of size and activity, both communities are comparable and offer a wealth of user-generated content and peer support. The choice between them might depend on individual preferences for community platform style and the type of content most valuable to a user.
Availability of Forums, Tutorials, and User-Generated Content: Both Power BI and Tableau communities offer a vast array of forums, tutorials, and user-generated content. Power BI community provides comprehensive official documentation, a rich library of tutorials on Microsoft Learn, and numerous community-led blogs, YouTube channels, and online courses. Tableau community offers extensive official documentation, Tableau Training videos, and a vast collection of user-created workbooks, visualizations on Tableau Public, and community-driven blogs and forums. Both communities excel in providing diverse learning resources, catering to different learning styles and skill levels. The availability of tutorials, sample workbooks, and community-generated content is abundant for both platforms, ensuring that users have access to ample learning materials and practical examples to enhance their skills. Whether it's official documentation, video tutorials, or community blog posts, both Power BI and Tableau ecosystems are rich in learning resources.
Official Support and Resources
Support Options and Resources Provided by Microsoft and Tableau: Both Microsoft and Tableau offer comprehensive official support and resources to assist their customers. Microsoft provides various support channels for Power BI, including online support tickets, phone support for enterprise customers, and extensive online documentation and knowledge bases. Microsoft's support ecosystem is vast and well-structured, catering to diverse customer needs. Tableau also offers robust support options, including online support portals, email support, phone support, and premium support plans for enterprise customers. Tableau's support is known for its responsiveness and technical expertise. Both companies provide comprehensive support ecosystems, ensuring that customers have access to assistance when needed. The specific support options and service level agreements may vary depending on the licensing tier and customer size. Enterprises with critical support requirements should carefully evaluate the support plans offered by both Microsoft and Tableau to ensure they align with their needs.
Training Programs and Certification Opportunities: For users seeking formal training and validation of their skills, both Power BI and Tableau offer certification programs and training resources. Microsoft provides Power BI certifications, such as the Microsoft Certified: Data Analyst Associate certification, which validates expertise in using Power BI for data analysis and visualization. Microsoft Learn platform offers structured learning paths and training modules to prepare for Power BI certifications. Tableau offers a range of certifications, including Tableau Desktop Specialist, Tableau Desktop Certified Associate, and Tableau Server Certified Associate, validating different levels of Tableau proficiency. Tableau also provides official Tableau Training courses, both online and in-person, to help users develop their Tableau skills and prepare for certifications. Both platforms offer valuable certification programs and training resources, enabling users to enhance their skills, gain industry recognition, and advance their careers in data analytics. The choice between certifications might depend on individual career goals and the specific skills they aim to validate.
6. Use Cases and Industry Applications

While both Power BI and Tableau are versatile BI tools applicable across various industries and use cases, certain scenarios might favor one tool over the other. This section will explore specific use cases and industry applications where Power BI and Tableau tend to excel, providing guidance on when to choose each platform.
When to Choose Power BI
Ideal Scenarios and Industry Examples Where Power BI Excels: Power BI is often the preferred choice in scenarios where organizations are deeply embedded in the Microsoft ecosystem, prioritize cost-effectiveness, and require strong integration with Microsoft cloud services.
- Microsoft-Centric Organizations: Companies heavily reliant on Microsoft technologies like Windows, Office 365, Azure, SQL Server, and Dynamics 365 often find Power BI a natural fit. Its seamless integration with these platforms simplifies data workflows, reduces integration costs, and leverages existing Microsoft investments.
- Cost-Conscious Businesses: For small businesses and organizations with budget constraints, Power BI's competitive pricing, especially Power BI Pro, makes it an attractive option. The potential bundling with Microsoft 365 subscriptions further enhances its cost-effectiveness.
- Real-Time Analytics on Azure: Organizations leveraging Azure for cloud infrastructure and requiring robust real-time analytics capabilities often favor Power BI due to its native integration with Azure Stream Analytics and Azure Event Hubs.
- Excel-Heavy Environments: Companies with a strong Excel culture and a large number of Excel-based reports and data models can benefit from Power BI's ability to seamlessly import and extend Excel functionalities.
- Operational Reporting and Dashboards: Power BI is well-suited for creating operational reports and dashboards that monitor day-to-day business performance, track KPIs, and provide real-time insights to operational teams.
- Industry Examples: Industries like finance, retail, manufacturing, and the public sector, where Microsoft technologies are widely adopted, often see strong Power BI adoption. For example, a retail company using Dynamics 365 for CRM and Azure SQL Database for data warehousing might choose Power BI for sales analytics, customer segmentation, and inventory management dashboards. A manufacturing company using Azure IoT Hub for sensor data and Azure Data Lake for data storage might leverage Power BI for real-time equipment monitoring and predictive maintenance dashboards.
When to Choose Tableau
Situations and Industries Where Tableau is the Better Choice: Tableau often shines in scenarios where visual aesthetics, advanced visualization capabilities, data storytelling, and flexibility in diverse technology environments are paramount.
- Visually Driven Organizations: Companies that prioritize visually stunning and highly customized dashboards and reports often prefer Tableau. Its granular control over visualization aesthetics and focus on visual best practices make it ideal for creating impactful presentations and data stories.
- Data Storytelling and Communication: Organizations that emphasize data storytelling and need to communicate insights to a broad audience, including non-technical stakeholders, often find Tableau's Story Points and data narrative features invaluable.
- Diverse Technology Environments: Companies with heterogeneous IT landscapes and a need to integrate with various databases, cloud platforms, and applications might favor Tableau's broad compatibility and open architecture.
- Exploratory Data Analysis: Tableau's intuitive drag-and-drop interface and interactive exploration capabilities make it well-suited for exploratory data analysis, ad-hoc querying, and uncovering hidden patterns in data.
- Advanced Analytics and Research: Industries and organizations involved in advanced analytics, research, and data science often leverage Tableau for its sophisticated visualization techniques and ability to handle complex datasets.
- Industry Examples: Industries like marketing, media, healthcare, education, and research, where visual communication and data exploration are critical, often see strong Tableau adoption. For example, a marketing agency might use Tableau to create visually engaging campaign performance dashboards and client reports. A healthcare organization might leverage Tableau for patient data visualization, disease pattern analysis, and public health dashboards. A research institution might use Tableau for visualizing complex scientific data, creating interactive research reports, and sharing findings with the scientific community.
7. Making the Decision: Power BI vs Tableau

Choosing between Power BI and Tableau is not about declaring one tool definitively "better" than the other. Both are powerful, feature-rich BI platforms capable of delivering significant value. The "right" choice depends entirely on your specific business needs, technical context, budget, priorities, and long-term analytical vision. This section summarizes the key considerations and provides a decision-making framework to guide you in selecting the tool that best aligns with your unique circumstances.
Key Considerations
Summary of Critical Factors to Consider Based on Business Needs:
- Microsoft Ecosystem Integration: If your organization is heavily invested in Microsoft technologies, Power BI's seamless integration offers significant advantages in terms of ease of use, reduced integration effort, and potential cost savings.
- Visual Aesthetics and Customization: If visual appeal and granular control over visualization design are paramount, Tableau's strengths in these areas might make it a more compelling choice.
- Data Storytelling and Communication: If data storytelling and communicating insights to a broad audience are key priorities, Tableau's Story Points and data narrative features offer a distinct advantage.
- Cost Sensitivity: For budget-conscious businesses, especially small businesses, Power BI's competitive pricing and potential bundling with Microsoft 365 can be highly attractive.
- Real-Time Analytics Requirements: If robust real-time analytics streaming and analysis are critical, Power BI's native integration with Azure real-time services might be a decisive factor, particularly for Azure-centric organizations.
- Ease of Use and Learning Curve: Consider your team's technical skills and learning preferences. Power BI's Microsoft-familiar interface might be initially easier for Excel users, while Tableau's drag-and-drop interface can be quickly accessible for visual learners.
- Data Connectivity Needs: Evaluate the diversity of your data sources and the level of connectivity required. Both tools offer broad connectivity, but assess if any specific connectors or integration needs are better addressed by one platform.
- Mobile Access Requirements: Both platforms offer mobile apps, but consider if specific mobile features or device responsiveness aspects are more critical for your mobile BI strategy.
- Security and Governance Requirements: Both platforms offer robust security features, but assess if any specific security compliance standards or governance requirements align better with one platform's approach.
- Community and Support Preference: Explore the user communities and support resources for both platforms and consider which community style and support options best align with your organization's support needs and preferences.
Decision-Making Framework
Practical Tips and a Checklist to Help Readers Choose the Right Tool for Their Specific Situation:
- Define Your Business Requirements: Clearly articulate your organization's BI needs, including reporting requirements, analytical goals, data visualization priorities, data sources, user base, and budget constraints.
- Evaluate Your Technical Environment: Assess your existing IT infrastructure, including your reliance on Microsoft technologies, cloud platforms, databases, and other business applications.
- Consider Your Team's Skills: Evaluate your team's current skill set and their learning preferences. Consider if familiarity with Microsoft tools or a visual learning style is more prevalent.
- Try Free Trials: Both Power BI and Tableau offer free trials or desktop versions. Take advantage of these to hands-on test both tools, explore their interfaces, and create sample dashboards using your own data.
- Request Demos: Contact Microsoft and Tableau sales teams to request personalized demos tailored to your specific use cases and business requirements.
- Read Reviews and Case Studies: Research online reviews, compare user feedback, and examine case studies of organizations in your industry using Power BI and Tableau.
- Consider Long-Term Scalability: Think about your future BI needs and scalability requirements. Evaluate if each platform can grow with your organization's data volume, user base, and analytical complexity.
- Factor in Total Cost of Ownership: Go beyond the license price and consider the total cost of ownership, including training costs, implementation effort, support costs, and potential infrastructure requirements.
- Prioritize Your Key Criteria: Based on your business requirements and evaluation, prioritize the key factors that are most critical for your organization's BI success.
- Make an Informed Decision: Weigh the pros and cons of each platform based on your prioritized criteria and make an informed decision that best aligns with your unique business context and long-term goals.
Conclusion
In the dynamic world of data analytics, both Power BI and Tableau stand as formidable tools, each possessing unique strengths and catering to diverse business needs. There is no single "winner" in the Power BI vs. Tableau debate; the optimal choice is profoundly contextual, shaped by your organization's specific requirements, technical landscape, budget, and analytical aspirations.
Power BI, with its seamless Microsoft ecosystem integration, cost-effectiveness, and robust real-time analytics capabilities, shines particularly brightly for organizations deeply entrenched in the Microsoft universe and those prioritizing operational reporting and Azure-centric solutions. Its familiar interface and competitive pricing make it an accessible and powerful option for a wide range of businesses, from small enterprises to large corporations.
Tableau, on the other hand, distinguishes itself with its visually stunning dashboards, advanced visualization capabilities, data storytelling prowess, and flexibility in diverse technology environments. It is a compelling choice for organizations that prioritize visual communication, data exploration, and require a tool that can seamlessly integrate with heterogeneous IT landscapes. Tableau's emphasis on visual analytics and data narrative makes it particularly effective for conveying insights to a broad audience and driving data-driven storytelling.
Ultimately, the journey to selecting the right BI tool is one of careful evaluation, hands-on testing, and alignment with your organization's unique DNA. By thoroughly assessing your business needs, technical environment, and long-term analytical vision, and by leveraging the decision-making framework outlined in this guide, you can confidently navigate the Power BI vs. Tableau landscape and empower your organization with the BI tool that best fuels your data-driven success. Remember, the most valuable tool is the one that empowers your team to unlock the insights hidden within your data and translate them into actionable strategies and impactful business outcomes.
What next?
Ready to embark on your journey with Power BI or Tableau? Explore the resources available on our website to delve deeper into each platform, access tutorials, and discover more about data visualization best practices. Share this guide with your colleagues and spark a data-driven conversation within your organization.
The world of data analytics is constantly evolving, and choosing the right BI tool is a strategic decision that can significantly impact your business trajectory. Take the time to carefully evaluate your options, test drive both Power BI and Tableau, and make an informed choice that empowers your team to harness the full potential of your data assets.
References and Further Reading
Below is a curated list of resources for those eager to deepen their understanding of Power BI, Tableau, and the broader landscape of business intelligence and data visualization:
- "The Definitive Guide to DAX: Business intelligence with Microsoft Power BI, SQL Server Analysis Services, and Excel" by Alberto Ferrari and Marco Russo: A comprehensive resource for mastering DAX, Power BI's formula language.
- "Tableau Desktop: A Practical Guide to Building Data Visualizations" by Ryan Sleeper: A hands-on guide to learning Tableau Desktop and creating effective visualizations.
- "Storytelling with Data: A Data Visualization Guide for Business Professionals" by Cole Nussbaumer Knaflic: A valuable resource for learning how to effectively communicate insights through data visualizations and storytelling techniques.
- Gartner Magic Quadrant for Analytics and Business Intelligence Platforms: An industry-recognized report evaluating and positioning BI platform vendors, including Power BI and Tableau. Available on Gartner's website.
- The official Power BI documentation and Microsoft Learn platform: Comprehensive resources for Power BI learning and documentation. Accessible through Microsoft's website.
- The official Tableau Help and Tableau Training resources: Extensive documentation and training materials for Tableau. Available on Tableau's website.